


 38 / 40

per annum over the following 10 years.
On the other hand, if an investor buys
when the market is expensive, prospective
returns can be significantly lower.At
the end of the 1990s, with the UK stock
market gripped by the dotcom bubble,
a P/E of 28 meant negative real returns
for investors over the following decade.
While there is no guarantee that future
returns will mirror this trend, the chart
suggests that the relationship between
starting valuation and subsequent
long-term returns is close. Interestingly,
the correlation is nowhere near as strong
over shorter time periods,when valuation
and fundamentals can be irrelevant;
a further reason to take a long-term
investment approach.
‘As the chart demonstrates,UK
INSIGHTS
38
|
THE INVESTOR
Research shows that starting valuations continue to be an
important indicator of long-term stock market returns
THE INVESTOR CENTRE
D
oes starting
valuation matter? It
is a question that is
often debated
among investors.
One of the key
variables investors use to determine
valuation is the price/earnings (P/E)
ratio.This is the ratio of a company’s
share price to its earnings per share.
In simple terms, a lower ratio indicates
better value.
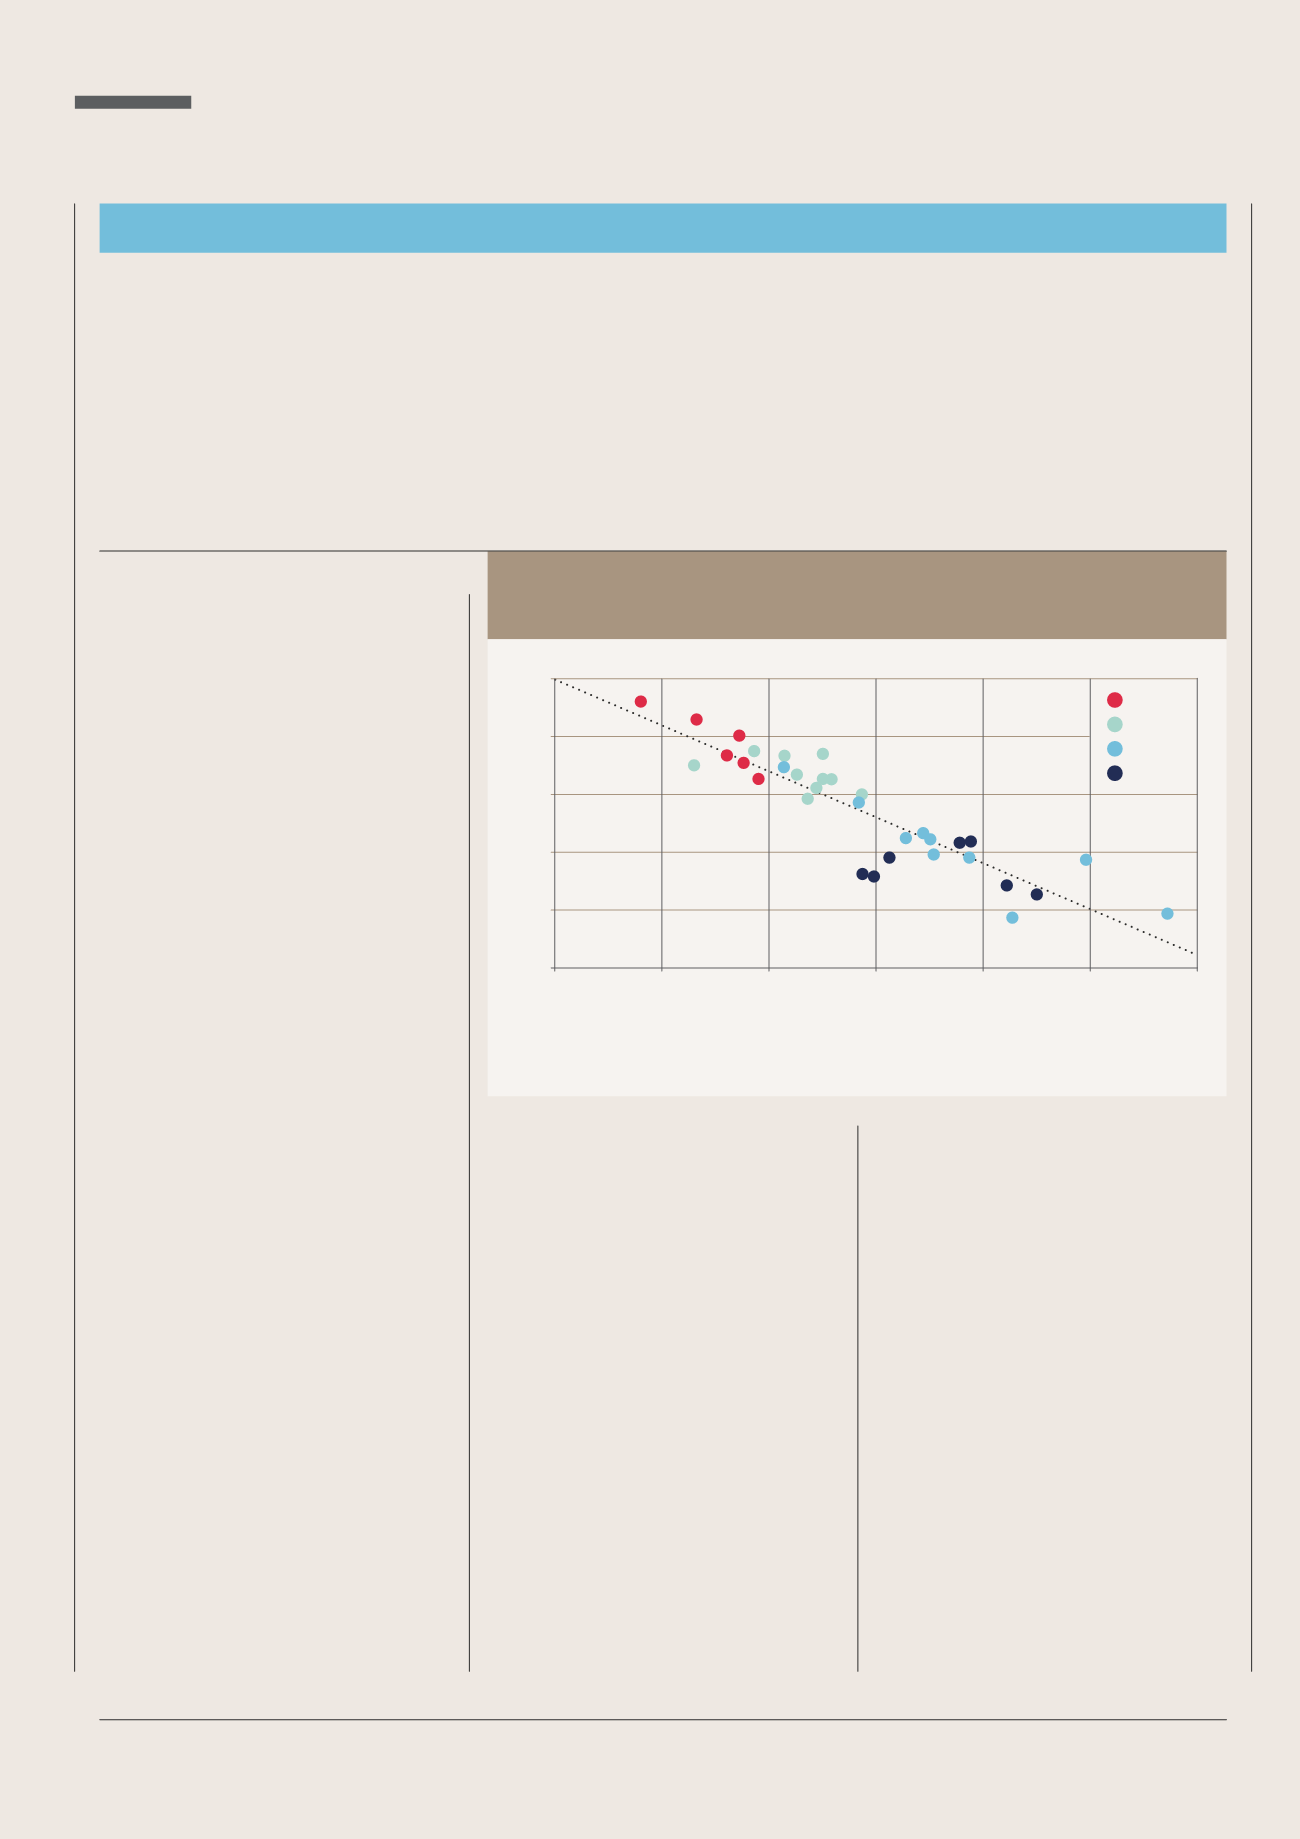
The chart opposite shows the starting
valuation of the UK stock market, in
terms of its P/E ratio, at the end of
every year since 1974.This is plotted
against the real annualised total return
that investors would have received over
the following decade if they had invested
at that point.
A key feature of the chart is the
diagonal trend line, which shows the
relatively strong correlation between the
percentage returns and the P/E at the
time of investment.A high P/E means
that investors must pay more for every
pound of company earnings (although
the level of earnings may, of course,
change once they own the stock).
A lower multiple means they are paying
less for those earnings.
For those who invest in the market
when its valuation is low, as it was in the
1970s and early 1980s, the prospective
returns can be very attractive indeed.
Investing at the end of 1974, for instance,
resulted in a real average return of 18%
Pricepower
equities are poised to deliver attractive
long-term returns from here, but it is as
essential as ever to be selective,’ says Neil
Woodford ofWoodford Investment
Management.‘Even in the dotcom
bubble, there were cheap stocks.Active
managers made attractive returns, even
though the broader UK stock market
stagnated for the best part of a decade.’
So what does this mean for today’s
investors? TheUK stockmarket’s current
P/E of about 15 times this year’s
anticipated earnings implies a real
annualised total return of around 8%
over the next 10 years, based on the
historic trend shown on the chart.
‘This isn’t bad, especially when
compared to the likely returns from
other asset classes,’ saysWoodford.
EQUITY STARTING VALUATIONS HAVE A STRONG
INFLUENCE ON LONG-TERM RETURNS
1
Source: 1 The Lazarus Partnership,Woodford, based on FTSE All Share total return data in UK sterling, adjusted for CPI inflation
10 year real annualised total returns (%)
Price / Earnings ratio at start of period
-5
0
5
10
15
20
25
30
0
5
10
1970s
1980s
1990s
2000s
15
20
Please be aware that past performance is not indicative of future performance. Equities do not include the security of capital
characteristic of a deposit with a bank or building society.