06
|
THE INVESTOR
ANALYSIS
GENERAL ELECTION
Must try harder or top of the class?With the general election a matter
of months away, we assess the term of the coalition government
By David Smith
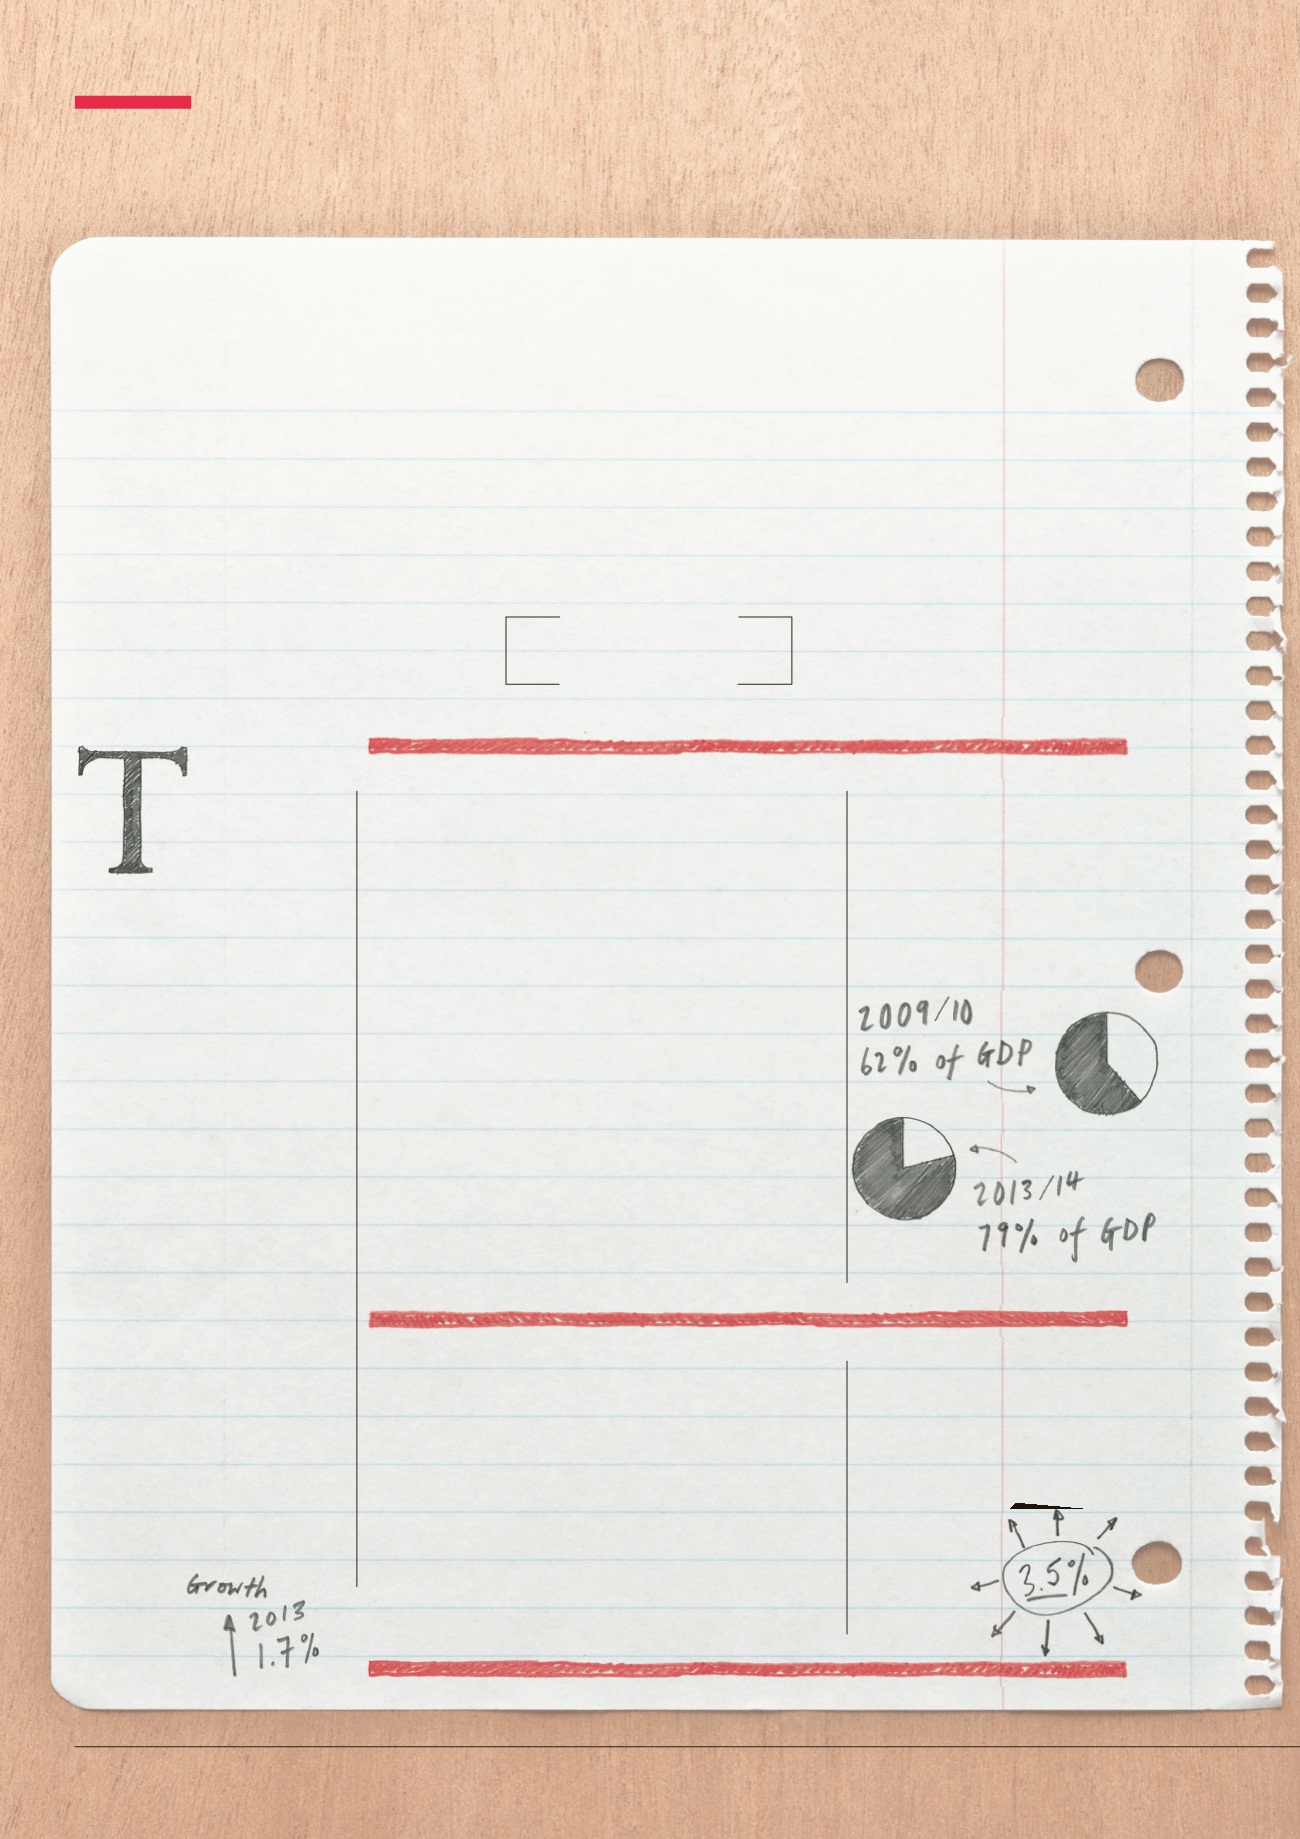
DEFICIT AND DEBT
The Conservative/Lib Dem coalition made deficit reduction a priority. In his
first ‘emergency’ Budget in June 2010, George Osborne set two targets:
to eliminate the so-called ‘structural current budget deficit’ by the end of
the parliament and to have debt falling as a percentage of GDP. Both were
supposed to be achieved by the 2015/16 fiscal year. How has he done?
On the official measure used for the overall budget deficit, public sector
net borrowing, excluding the state-owned banks, fell from £153 billion in
2009/10 to £97.5 billion in 2013/14. The Office for Budget Responsibility
(OBR) predicts £91.3 billion for this year. In the original 2010 plan, the
deficit was intended to be £60 billion in 2013/14 and £37 billion in
2014/15. Public sector net debt rose from £956 billion at the end of the
2009/10 fiscal year, 62% of GDP, to £1,402 billion at the end of 2013/14,
79% of GDP. In late 2014 it was just over £1,450 billion.
On the two measures targeted by Osborne, the cyclically adjusted
current budget deficit and public sector net debt, there has been some
slippage. The former was supposed to have been eliminated by 2015/16
and the latter on a declining trend in relation to GDP. The latest OBR
assessment is that there will be a cyclically adjusted current deficit of 2.2%
of GDP, £41.5 billion, in 2015/16, and that it will not be eliminated until
2017/18. Public sector net debt will peak at 81.1% of GDP in 2015/16,
higher than planned, and begin to fall in 2016/17.
- -
he general
election in May
2015 is one of
the hardest to
predict for many
years.The two main parties
are broadly neck and neck in
the polls.The rise of the UK
Independence Party and the
aftermath of the independence
vote in Scotland, which has
sparked a surge in the popularity
of the Scottish National Party,
add to the uncertainty.Another
coalition – rather a curiosity in
2010 – may be the outcome.
One thing we know will play a
big part in the result will be the
performance of the economy
since May 2010. Does the
government have a record it can
be proud of, and how much is
there still left to do?
SCORECARD RESULT
There has been a considerable
reduction in the budget deficit,
which the coalition will trumpet.
But the original aim of dealing
with the deficit problem during this
parliament has not been achieved.
GROWTH
The Bank of England, in its November 2014 Inflation Report, predicted the
economy to grow by 3.5% in 2014, and by 2.9% in 2015.This suggests
a good rate at the time of the election. It has not, however, all been plain
sailing. Figures from the Office for National Statistics show that the coalition
has presided over three years in which the economy grew more slowly than
in 2010, the year it took office. Growth of 1.9% in 2010 was followed by
1.6% in 2011, 0.7% in 2012 and 1.7% in 2013.
Treasury ministers say that the weaker growth in the period from 2011
to 2013 was due to the impact of the crisis in the eurozone and high,
commodity-driven inflation. Labour says that the period of ‘flatlining’ was
because of the government’s austerity policies.
SCORECARD RESULT
Growth has come through strongly
in the run-up to the election, but
for much of the parliament the
coalition has presided over a very
weak recovery. There is ammunition
here for both the government and
its opponents.


